
RESEARCH ARTICLE
Ripplet-Transform-based Cycle Spinning Denoising and Fuzzy-CLA Segmentation of Retinal Images for Accurate Hard Exudates and Lesion Detection
Hadi Chahkandi Nejad1, *, Mohsen Farshad2, Tahereh Farhadian3, Roghayeh Hosseini4
Article Information

Identifiers and Pagination:
Year: 2019Volume: 11
First Page: 8
Last Page: 17
Publisher Id: TOMIJ-11-8
DOI: 10.2174/1874347101911010008
Article History:
Received Date: 17/06/2019Revision Received Date: 07/11/2019
Acceptance Date: 11/11/2019
Electronic publication date: 20/12/2019
Collection year: 2019
open-access license: This is an open access article distributed under the terms of the Creative Commons Attribution 4.0 International Public License (CC-BY 4.0), a copy of which is available at: (https://creativecommons.org/licenses/by/4.0/legalcode). This license permits unrestricted use, distribution, and reproduction in any medium, provided the original author and source are credited.
Abstract
Aims:
Digital retinal images are commonly used for hard exudates and lesion detection. These images are rarely noiseless and therefore before any further processing they should be underwent noise removal.
Background:
An efficient segmentation method is then needed to detect and discern the lesions from the retinal area.
Objective:
In this paper, a hybrid method is presented for digital retinal image processing for diagnosis and screening purposes. The aim of this study is to present a supervised/semi-supervised approach for exudate detection in fundus images and also to analyze the method to find the optimum structure.
Methods:
Ripplet transform and cycle spinning method is first used to remove the noises and artifacts.
Results:
The noises may be normal or any other commonly occurring forms such as salt and pepper. The image is transformed into fuzzy domain after it is denoised.
Conclusion:
A cellular learning automata model is used to detect any abnormality on the image which is related to a lesion. The automaton is created with an extra term as the rule updating term to improve the adaptability and efficiency of the cellular automata.Three main statistical criteria are introduced as the sensitivity, specificity and accuracy. A number of 50 retinal images with visually detection hard exudates and lesions are the experimental dataset for evaluation and validation of the method.
1. INTRODUCTION
In ophthalmology, the automatic detection of blood vessels, as well as the detection of the optic disc, may be of considerable interest in computer assisted diagnosis. Detecting and counting lesions, in the human retina such as micro-aneurysms and exudates, is a time-consuming task for ophthalmologists and open to human error. That is why much effort has been made to detect lesions in the human retina automatically [1]. Diabetic Retinopathy (DR) is a visual complication of diabetes, which has become the most common cause of visual impairment and new-onset blindness among people of working age in industrialized countries [2, 3]. Due to its prevalence and clinical significance, the research community has attempted to improve its diagnosis and treatment by developing algorithms to perform retinal image analysis [4], fundus image enhancement [5], and monitoring [6]. Of special significance are automatic image analysis algorithms designed to detect Hard Exudates (HEs) [7]. HEs have been found to be the most specific markers for the presence of retinal oedema, the major cause of visual loss in non-proliferative forms of DR [2]. Additionally, HEs are one of the most prevalent lesions during the early stages of DR [2].
In many applications, image denoising is a tool by which a good estimate of the original image from noisy states is provided. An ideal image denoising technique makes it possible to eliminate as much random additive noise as possible while maintaining key image characteristics, such as edges and texture. Among the many methods proposed for this purpose, i.e. image denoising, due to their high ability in the sparse representation of signals, transform based methods (e.g., wavelets) [8] are dominant in this application.
Automatic algorithms for HE detection are required in a variety of applications, including the design of complete systems for automatic processing of retinal images. Several techniques have been developed for HE detection in fundus images based on a variety of techniques [7]. These techniques include the usage of image contrast and brightness analysis [9-15], Bayesian classifiers [16, 17], and neural networks [18, 19].
Zhang et al. [20] used local contrast enhancement and Fuzzy C-means Clustering (FCMC) in Luv color space to segment candidate bright exudates areas. However, the main difficulty with FCMC is determining the number of clusters to use. Walter et al. [21] applied mathematical reconstruction to detect contours typical of exudates. This technique achieved predictive and sensitivity values of 92.4% and 92.8% with a set of 15 abnormal retinal images. However, this technique did not discriminate exudates from cotton wool spots. Gardner et al. [22] used the backpropagation neural network for the segmentation of exudates. Comparing the results of this method with those of an expert ophthalmologist, the method achieved a sensitivity and specificity of 88.4% and 83.5%, respectively, for the detection of exudates. A drawback of this method was that it did not work well on poor quality images.
Most of the previous techniques have based on retinal features being clearly visible on acquired imagery. Acquiring clearly visible retinal features takes time and it is uncomfortable for patients. Moreover, sometimes, there are a number of exudates with different sizes apart or stuck, which require a model-based method for detection. Therefore, in this paper, the cellular learning automata in the fuzzy domain is used for automated and accurate detection of exudates on retinal images. The ultimate aim was to develop an application for automatic detection of exudates, to provide decision support and to reduce workloads for expert ophthalmologists by a supervised method, which can also act as an automation system.
Cellular Automata (CA) consist of a regular grid of cells, each of which can be in only one of a finite number of possible states. The state of a cell is determined by the previous states of a surrounding neighborhood of the cells and is updated synchronously in discrete time steps. The identical rule contained in each cell is essentially a finite state machine, usually specified in the form of a rule table with an entry for every possible neighborhood configuration of states. Cellular automata are discrete dynamical systems, and they have been found useful for simulating and studying phenomena such as ordering, turbulence, chaos, symmetry-breaking, etc., and have had wide application in modeling systems in areas such as physics, biology and sociology. One of the advantages of CAs is that, although each cell generally only contains a few simple rules, the combination of a matrix of cells with their local interaction leads to more sophisticated emergent global behavior. That is, although each cell has an extremely limited view of the system (just its immediate neighbors), localized information is propagated at each time step, enabling more global characteristics of the overall CA system [23].
In this paper, a denoising method based on ripplet transform is first presented. Fuzzified cellular learning automata are then introduced for the segmentation of denoised retinal images. A retinal image dataset consisting of 50 retinal images with hard exudates is used to assess the proposed method. The paper is organized as follows: Section 2 presents the dataset and the methodology results are given in Section 3 and in Section 4, the results are discussed. Finally, some conclusions are drawn in Section 5.
2. MATERIALS AND METHODS
2.1. Image Database
The main dataset was a subset of the STARE Project’s dataset [27]. The subset contained 81 retinal images for evaluating the proposed exudates detection method. The images were captured using a TopCon TRV-50 fundus camera at 35º field-of-view (FOV), and subsequently digitized at 605 × 700, 24-bits pixel. The dataset was used for both the evaluation of the proposed method and also comparison to some other methods. The dataset consisted of a total of 50 color retinal images which were taken without pupil dilation with a KOWA-7 non-mydriatic retinal camera with a 45º FOV. The image size was 768×576 pixels at 24 bits per pixel in RGB format. All retinal images analyses were performed on a Core2 Duo 2.2 GHz Laptop using MATLAB 7.6.0 for all implementations.
2.2. Denoising Digital Retinal Images
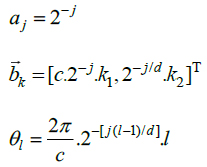
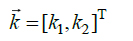
The processing of digital retinal images is only possible by the discrete form of the transform methods. Hence, the discrete form of ripplet transform is applied to digital retinal images for denoising purposes. Analogously to the discrete curvelet transform, the discretization of continuous ripplet transform is based on the discretization of the parameters of ripplets, i.e.
 To this end, a is sampled at the dyadic interval while the position parameter
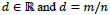
 and the rotation parameter
 are sampled at the equal-spaced intervals. The discrete versions of
 are denoted by
 which satisfy that, (Eq.1)
 |
(1) |
in which (Eq.2)
 |
(2) |
and operator T denotes the transpose of a vector,

 (usually m and n are both primes),
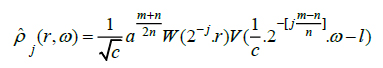
 [8]. Therefore, the frequency response of discrete ripplet function can be represented as, (Eq.3)
 |
(3) |
In which W and V satisfy the following admissibility condition (Eqs.4 and 5):
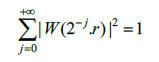 |
(4) |
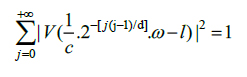 |
(5) |
In the frequency domain, the ‘wedge’ of the ripplet function can be represented as (Eq.6):
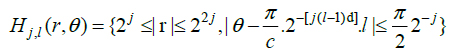 |
(6) |
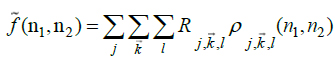
Finally, for an arbitrary image f(n1,n2) with size L x M the discrete ripplet coefficients will be in the form of (Eq.7):
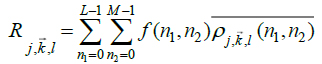 |
(7) |
The image can be reconstructed from the coefficients
 through inverse discrete ripplet transform (Eq.8):
 |
(8) |
In the shift variant transforms such as ripplet transform, the pseudo-Gibbs phenomenon results in appearing artifacts in the singularities around the edges of the reconstructed image. To alleviate these artificial edges, traditional methods use a strategy in which the image is shifted to change the position of the discontinuity point [8]. After processing (denoising in our case) shifted image, the inverse shifting was applied to the shifted image.
Assume f(n1,n2) be the noisy image, fˆ(n1,n2) be the estimation of noise-free image, R and R-1 denote the ripplet transform and the inverse ripplet transform, respectively, dx,y and is the shift distance along the horizontal direction x and vertical direction y, respectively [13]. Thus, if the image is shifted with a certain distance, dx,y the denoising strategy using the cycle spinning method can be expressed as follows (Eq.9).
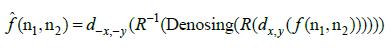 |
(9) |
where denoising is the process described in the previous section. However, this strategy works, when the number of discontinuous points in an image is small, whereas the shift may cause serious pseudo-Gibbs phenomenon in the area of other discontinuous points. Therefore, it is hard to find a proper shift distance which can cope with all of discontinuous points in the image. Thus, the cycle spinning method is proposed to tackle this problem in denoising of images.
Given
 which indicate a set of shift arranges
 in vertical direction and
 in horizontal direction, and considering that all the x and y should be less than the columns and the rows of the image, respectively, averaging the denoised image after a series of the cycle spinning, gives the denoised image in which the pseudo-Gibbs phenomenon is alleviated. The denoising method utilizing the cycle spinning can be described by the following formula (Eq.10).
 |
(10) |
2.3. Transformation of Retinal Images into Fuzzy Domain
Let us consider an image of size M x N pixels, having L gray levels g ranging from 0 to L - 1. The image Y can be viewed as an array of fuzzy singletons [19]. Each element of the array is the membership value
 of the gray level
 , corresponding to the
 pixel, regarding an image property such as brightness, edginess, homogeneity, etc. Using the fuzzy sets notation image
 can be represented as (Eq.11):
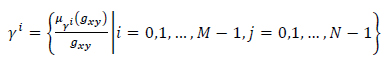 |
(11) |
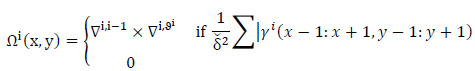
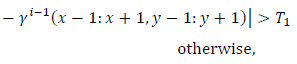
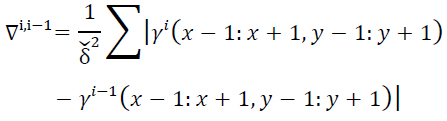
To enhance the gray levels across the edges and to improve the contrast of the image, gray levels of the pixels are normalized to unit interval  function over
 neighborhood windows around all pixels as (Eqs.12-14),
 |
 |
(12) |
where
 |
(13) |
and
 |
(14) |
Matrix
 is obtained as the primary motion detected in
 image of the image set
 . Parameter
 is the threshold value for motion detection in corresponding
 neighborhood windows in image sequence
 and
and
 . Coefficient
 means the first order absolute gradient of the sequent images
 and
and
 depicts the first order gradient of the image relative to the average of the previous images
 Multiplication of the two terms in Eq. (2) guarantees both of these statements: (a) difference with the previous image implies motion and (b) slight differences with the average of images represent vibration and undesired motions (e.g., shadows, camera shaking or local illumination variations).
The matrix
undergoes normalization in the [minimum,maximum] range as, (Eq.15),
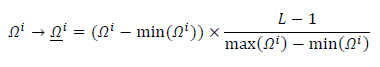 |
(15) |
Therefore matrix
is normalized to the range which has been converted to grayscale image format.
2.4. Retinal Image Fuzzy Automaton
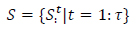
A retinal image fuzzy automaton in the Fuzzy Cellular Learning Automata is created as, (Eq.16)
 |
(16) |
S: States as
 in the range
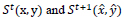
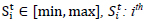 State at time t where:
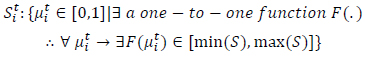 |
and
 |
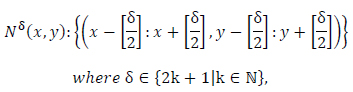
N: Neighborhood as
 Extended Moore Neighborhoods:
 |
R: Rules as
 |
which are once defined by the user according to a set of training samples.
 Parameters as
 penalty and T: similarity threshold where
 .
.
 |
States in the automaton correspond to decision variables of the problem. The rules are set as transition functions (Eq.17):
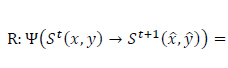 |
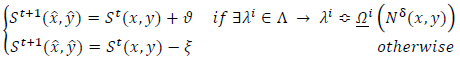 |
(17) |
where
 is the transition function,
 correspond to the current state and the next state,
 are the score and penalty values, respectively,
 is the set of rules and the term
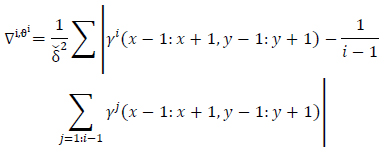
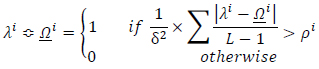
 implies the conditional rule applying. The condition under which the appropriate rule is selected and then applied can be logically expressed as (Eq.18):
 |
(18) |
where
 is the accordance factor for the ith rule. The conditional term of the above equation is similar to searching within a look-up table, which comprises a set of predefined state rules. Threshold
selection directly specifies the sensitivity to the rules selection and to the state changes. Very low
values lead to significant score assignments and it may result in enlarging the state values and also vice versa. Therefore, this parameter can be justified in each time interval of the cellular automata and this updating process leads to a learning scheme. Threshold value
is updated in each cycle according to this formula (Eq.19):
is the accordance factor for the ith rule. The conditional term of the above equation is similar to searching within a look-up table, which comprises a set of predefined state rules. Threshold
selection directly specifies the sensitivity to the rules selection and to the state changes. Very low
values lead to significant score assignments and it may result in enlarging the state values and also vice versa. Therefore, this parameter can be justified in each time interval of the cellular automata and this updating process leads to a learning scheme. Threshold value
is updated in each cycle according to this formula (Eq.19):
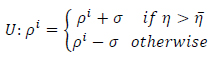 |
(19) |
where
 is the updating additive value ranged between 0.001 and 0.1. Parameter
is the ratio of state overall variation in three sequent cycles in cellular automata and
is the updating additive value ranged between 0.001 and 0.1. Parameter
is the ratio of state overall variation in three sequent cycles in cellular automata and
 is a threshold value for
 . For simplicity
 can be initially set as 0.6 and
 is randomly selected in the unit interval
 larger if the rule selection sensitivity and the score assignment raise significantly since larger
 values limit the score assignments (and vice versa). The evolution cycle of the Cellular Learning Automata goes forward according to the learning rule. Score and penalty parameters can also be updated in each cycle but they are preferred to be set as low as possible initially and the convergence to be reached in a long time. Applying appropriate learning functions to the rules will guarantee the convergence and goal tracing capability of the model.
2.5. Segmentation of Retinal Images
For lesion detection in retinal images, a binary image comprising two segments of the healthy area of the retina as background and the detected lesion(s) as the foreground is desired. Therefore, since after the cycle
 , the resulting image is in the fuzzy domain and its pixels are in the unit interval, a non-sensitive threshold
 ranged between 0.1 and 0.9 is selected to produce a binary image
 as:
as:
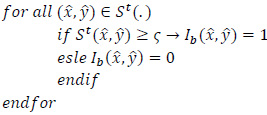 |
2.6. Segmentation Quantitative Criteria
To report the performance of the classifier, the three common criteria sensitivity, specificity and accuracy are reported and calculated as follows (Eqs.20-22):
 |
(20) |
 |
(21) |
 |
(22) |
where the abbreviations and their meanings are summarized in Table 1. The sensitivity results describe the percentage of correctly detected object’s pixels. The specificity result demonstrates the percentage of incorrect assignments of the pixels and the accuracy shows the validity of the assignments. The higher accuracy percentage reveals the higher veracity of results.
3. SIMULATION RESULTS
A number of 50 retinal images with hard exudates and lesion detected visually are considered as the dataset to evaluate the proposed segmentation method. Implementations of the proposed method were done in MATLAB software using an image processing toolbox. All codes were developed in MATLAB M-files, while a set of the images is copied in the same directory as the M-file. The program consists of four main parts: denoising step, initialization part, segmentation method and image binarization and assessment part.
In our experiments, we first evaluated the methods to find the optimum parameter values and the most suitable structure. Then, the results of the retina exudates detection for the proposed method are compared to the results of some other methods in recent literature. All detections were executed for lesion based images with no limitations in the number and regions of the lesions. A lesion is considered a true positive (TP) if it overlaps at least in part with the ground-truth; a false negative (FN) if no corresponding lesion is found in the automatic segmentation; a false positive (FP) if an exudate is found in the automatic segmentation, but no corresponding lesion has been manually segmented. In the evaluation of the segmentation, true negatives (TN) are the true assignments to the non-lesion regions.
| Abbreviation | Stands for | Description |
|---|---|---|
| TP | True Positive | Pixels correctly detected as an object |
| FP | False Positive | Pixels incorrectly marked as an object |
| TN | True Negative | Pixels correctly marked as background |
| FN | False Negative | Pixels incorrectly labeled as background |
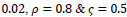
In the first part of the experiments, the effects of the score and penalty values for two iteration values were studied. All runs have been done for two neighborhood sizes of 3×3 and 5×5. Samples of the original retinal images with hard exudates are shown in (Figs. 1-3) show noisy images and the images denoised by the ripplet transform-based denoising method presented in this paper. Segmented images of retinal images are shown in Fig. (4). The images in Fig. (4) correspond to the implementation of the proposed method with a marginally optimum set of parameters, while their numerical results are given in Table 2. The results of statistical analysis on the score and penalty assignments are given in Table 2 while the proposed method is used with and without the denoising process. It is shown that the optimum score and penalty values stand about 0.01 and 0.02 while the product of score/penalty values and the number of iterations is important. The denoising process improves the statistical parameters of about 4-6%. It is also shown that for our dataset images, the neighborhood size of 5×5 which is an extended Moore neighborhood, leads to better results as compared to the simple Moore neighborhood.
Table 3 shows the results of a brief comparison between the Fuzzy cellular automata and fuzzy cellular learning automata. For this part of the experiment, the rules are updated for two values of
 . Parameter
 affects the rate of score assignment and
 determines the threshold for rule selection. Optimum values for
 are found as
 Different similarity thresholds for rule selection from 0.5 to 0.95 are used to figure out the detected exudates and it has been shown that low threshold values result in enlarged detected regions and vice versa. It happens because low threshold values cause higher rates of rule selection and applying rules relates to the score assignment and exudates configuration. The similarity threshold value
 equally for all rules has been found optimum.
The final state of the FCLA iterative method gives out a retina image with segmented exudates. Based on the number of iterations, defined rules and the values of score and penalty, the final state may be an image in the fuzzy domain and its pixels ranged in the unit interval. Hence, a threshold parameter for image binarization
 is proposed to assign the pixels of the images either 0 or 1 according to their fuzzy value. If appropriate rules are defined and suitable values for
 are set, the sensitivity to parameter
is too low. Then the values in the range [0.3, 0.9] will lead to slightly different binary images. The differences between the statistical parameters for three different values of
are demonstrated in Table 4.
are set, the sensitivity to parameter
is too low. Then the values in the range [0.3, 0.9] will lead to slightly different binary images. The differences between the statistical parameters for three different values of
are demonstrated in Table 4.
Comparison to some other methods is performed in terms of the statistical parameters. To evaluate the efficiency of the proposed FCLA method, the results of the six methods of references [15, 19-22], K-Nearest Neighbor method are listed in Table 5. The results for the proposed method are attained with the optimum parameters found in the previous parts of the experiment. These parameters are


 It is seen that the proposed method with its optimum parameters can detect the exudates in retina images accurately with high sensitivity and specificity.
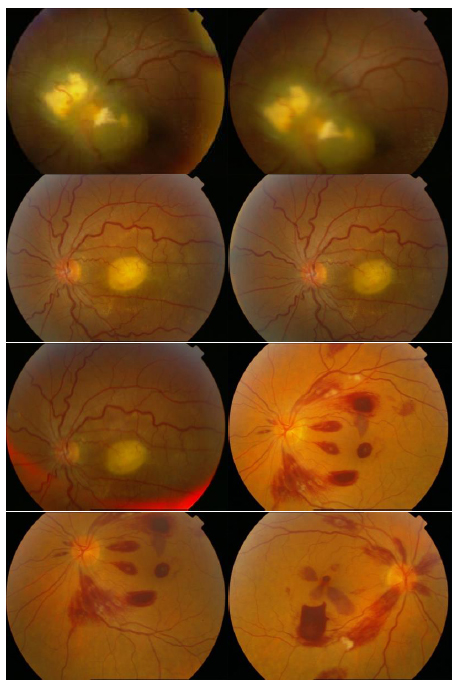 |
Fig. (1). Original Retinal Images with hard exudates. |
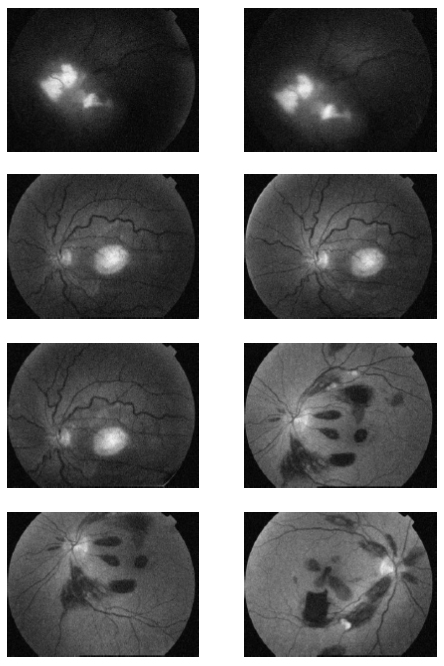 |
Fig.(2). Noisy Retinal Images with hard exudates (salt and pepper noise). |
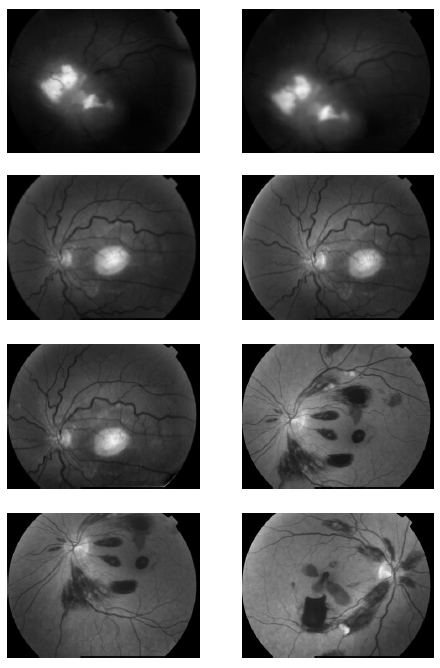 |
Fig. (3). Denoised Retinal Images by cycle spinning and ripplet transform. |
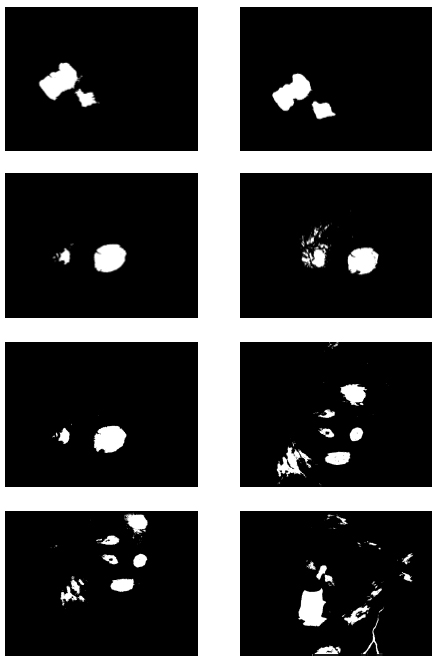 |
Fig. (4).
Segmented Retinal Images by the FCLA after the denoising process while
 . .
|
 =50) averaged over 50 images.


 .
.Updating Rules with Default
 |
||||||
|---|---|---|---|---|---|---|
| Fixed Rules |

|

|

|

|

|
|
| Sensitivity | ~83% | ~88% | ~88% | ~84% | ~90% | ~83% |
| Specificity | ~92% | ~97% | ~91% | ~93% | ~87% | ~96% |
| Accuracy | ~84% | ~89% | ~83% | ~87% | ~81% | ~81% |
| Average | ~86.3% | ~91.3% | ~87.3% | ~88% | ~86% | ~86.7% |
 .
. .
.| Method | NI/NIEx | Sensitivity | Specificity | Accuracy | |
|---|---|---|---|---|---|
| Zhang et al. [20] | SVM | 213/213 | 88% | 84% | - |
| Wang et al. [17] | SVM | 154/54 | 100% | 71% | - |
| Osareh [24] | FCMC | 300/300 | 96% | 94.6% | - |
| Garcia et al. [25] | MLP | 50/25 | 84% | 62.7% | - |
| Wisaeng et al. [26] | SVM | 120/98 | 94% | 89.52% | - |
| KNN | KNN | 50/20 | 93% | 92% | 93% |
| CLA [28] | CLA | 50/20 | 96.3% | 98.7% | 96.1% |
| Proposed method 1 | Hybrid | 50/20 | 98.3% | 98.1% | 97.3% |
| Proposed method 2 | Hybrid | 50/20 | 99.4% | 99.6% | 99.1% |
CONCLUSION
In this paper, a hybrid method was presented for digital retinal image processing for diagnosis and screening purposes. A supervised/semi-supervised approach for exudate detection in fundus images was presented and the optimum structure was found in a comprehensive analysis. Ripplet transform and cycle spinning method was used to remove the noises and artifacts. The image was transformed into a fuzzy domain after it was denoised. A cellular learning automata model was used to detect any abnormality in the image, which is related to a lesion. STARE retina image dataset, for a neighborhood of 5 x 5, score of
 , penalty of
 , ratio of state overall variation in three sequent cycles in cellular automata
 , updating additive value
 and rule selection threshold value
 the mean value of statistical criteria averaged over all dataset can reach 99% which is an outstanding assessment result for the proposed method. Considering the advantages and proficiencies of the proposed method, one may be interested in a more rapid algorithm for real-time applications where the processing should be accomplished in a short fraction of time. Hence, the authors suggest further studies and analyses of the computation time for the proposed method in the future.
ETHICS APPROVAL AND CONSENT TO PARTICIPATE
Not applicable.
HUMAN AND ANIMAL RIGHTS
No animals/humans were used for studies that are the basis of this research.
CONSENT FOR PUBLICATION
Not applicable.
AVAILABILITY OF DATA AND MATERIALS
Not applicable.
FUNDING
None.
CONFLICT OF INTEREST
The author declares no conflict of interest, financial or otherwise.
ACKNOWLEDGEMENTS
The authors would like to thank the staff and members of the research center, Birjand branch, Islamic Azad University, Birjand, Iran.
REFERENCES
| [1] | Walter T, Klein JC. Segmentation of color fundus images of the human retina: Detection of the optic disc and the vascular tree using morphological techniques InInternational Symposium on Medical Data Analysis 2001. |
| [2] | García M, Sánchez CI, Poza J, López MI, Hornero R. Detection of hard exudates in retinal images using a radial basis function classifier. Ann Biomed Eng 2009; 37(7): 1448-63. |
| [3] | Singer DE, Nathan DM, Fogel HA, Schachat AP. Screening for diabetic retinopathy. Ann Intern Med 1992; 116(8): 660-71. |
| [4] | Sánchez CI, Hornero R, López MI, Aboy M, Poza J, Abásolo D. A novel automatic image processing algorithm for detection of hard exudates based on retinal image analysis. Med Eng Phys 2008; 30(3): 350-7. |
| [5] | Cree MJ, Olson JA, McHardy KC, Sharp PF, Forrester JV. The preprocessing of retinal images for the detection of fluorescein leakage. Phys Med Biol 1999; 44(1): 293-308. |
| [6] | Pinz A, Bernögger S, Datlinger P, Kruger A. Mapping the human retina. IEEE Trans Med Imaging 1998; 17(4): 606-19. |
| [7] | Patton N, Aslam TM, MacGillivray T, et al. Retinal image analysis: concepts, applications and potential. Prog Retin Eye Res 2006; 25(1): 99-127. |
| [8] | Eslami R, Radha H. The contourlet transform for image denoising using cycle spinning. InThe Thrity-Seventh Asilomar Conference on Signals, Systems & Computers, 2003 2003 Nov 9 (Vol. 2, pp. 1982-1986). IEEE |
| [9] | Akita K, Kuga H. A computer method of understanding ocular fundus images. Pattern Recognit 1982; 15(6): 431-43. |
| [10] | Kochner B, Schulman D, Obermaier M, Zahlmann G, Mann G, Englmeier KH. A image processing system for analyzing color fundus photographs with regard to diabetic retinopathy. Klin Monatsbl Augenheilkd 1997; 211: 11. |
| [11] | Li H, Chutatape O. Automated feature extraction in color retinal images by a model based approach. IEEE Trans Biomed Eng 2004; 51(2): 246-54. |
| [12] | Phillips R, Forrester J, Sharp P. Automated detection and quantification of retinal exudates. Graefes Arch Clin Exp Ophthalmol 1993; 231(2): 90-4. |
| [13] | Walter T, Klein JC, Massin P, Erginay A. A contribution of image processing to the diagnosis of diabetic retinopathy-detection of exudates in color fundus images of the human retina. IEEE Trans Med Imaging 2002; 21(10): 1236-43. |
| [14] | Ward NP, Tomlinson S, Taylor CJ. Image analysis of fundus photographs. The detection and measurement of exudates associated with diabetic retinopathy. Ophthalmology 1989; 96(1): 80-6. |
| [15] | Zahlmann G, Kochner B, Ugi I, et al. Hybrid fuzzy image processing for situation assessment. IEEE Eng Med Biol Mag 2000; 19(1): 76-83. |
| [16] | Goh KG, Hsu W, Lee ML. Automatic Diabetic Retinal Image Screening Using Image Processing and Machine Learning Algorithms. InSPIE Conference on Medical Imaging 2000. |
| [17] | Wang H, Hsu W, Goh KG, Lee ML. An effective approach to detect lesions in color retinal images. InProceedings IEEE Conference on Computer Vision and Pattern Recognition CVPR 2000 (Cat. No. PR00662) 2000 Jun 15. 2: 181-18. IEEE |
| [18] | Gardner GG, Keating D, Williamson TH, Elliott AT. Automatic detection of diabetic retinopathy using an artificial neural network: a screening tool. Br J Ophthalmol 1996; 80(11): 940-4. |
| [19] | Osareh A. Automated identification of diabetic retinal exudates and the optic disc (Doctoral dissertation, University of Bristol) |
| [20] | Zhang X, Chutatape O. Top-down and bottom-up strategies in lesion detection of background diabetic retinopathy. 2005 IEEE Computer Society Conference on Computer Vision and Pattern Recognition (CVPR’05) 2005; 2: 422-8. |
| [21] | Walter T, Klein JC, Massin P, Erginay A. A contribution of image processing to the diagnosis of diabetic retinopathy--detection of exudates in color fundus images of the human retina. IEEE Trans Med Imaging 2002; 21(10): 1236-43. |
| [22] | Gardner GG, Keating D, Williamson TH, Elliott AT. Automatic detection of diabetic retinopathy using an artificial neural network: a screening tool. Br J Ophthalmol 1996; 80(11): 940-4. |
| [23] | Rosin PL. Training cellular automata for image processing. IEEE Trans Image Process 2006; 15(7): 2076-87. |
| [24] | Osareh A, Mirmehdi M, Thomas B, Markham R. Classification and localisation of diabetic-related eye disease. In European Conference on Computer Vision 2002. |
| [25] | Garcia M, Hornero R, Sánchez CI, López MI, Díez A. Feature extraction and selection for the automatic detection of hard exudates in retinal images. In2007 29th Annual International Conference of the IEEE Engineering in Medicine and Biology Society 2007. Aug 22 (pp. 4969-4972). IEEE. |
| [26] | Wisaeng K, Hiransakolwong N, Pothiruk E. Automatic detection of retinal exudates using a support vector machine. Appl Med Inform 2013; 32(1): 33-42. |
| [27] | STARE Project Website Clemson University, Clemson, SC [online]. Available:. http://www.ces.clemson.edu/~ahoover/stare |
| [28] | Nejad HC, Azadbakht B, Adenihvand K, Mohammadi M, Mirzamohammad M. Fuzzy cellular learning automata for lesion detection in retina images. J Intell Fuzzy Syst 2014; 27(5): 2297-303. |