
RESEARCH ARTICLE
ProgNet: COVID-19 Prognosis Using Recurrent and Convolutional Neural Networks
Mohamed Fakhfakh1, Bassem Bouaziz1, Faiez Gargouri1, Lotfi Chaari2, *
Article Information

Identifiers and Pagination:
Year: 2020Volume: 12
First Page: 11
Last Page: 12
Publisher Id: TOMIJ-12-11
DOI: 10.2174/1874347102012010011
Article History:
Received Date: 23/05/2020Revision Received Date: 19/09/2020
Acceptance Date: 17/10/2020
Electronic publication date: 31/12/2020
Collection year: 2020
open-access license: This is an open access article distributed under the terms of the Creative Commons Attribution 4.0 International Public License (CC-BY 4.0), a copy of which is available at: https://creativecommons.org/licenses/by/4.0/legalcode. This license permits unrestricted use, distribution, and reproduction in any medium, provided the original author and source are credited.
Abstract
Aims:
Prognosis of lung mathology severity after Covid-19 infection using chest X-ray time series
Background:
We have been inspired by methods analysing time series of images in remote sensing for change detection. During the current Covid-19 pandemic, our motivation is to provide an automatic tool to predict severity of lung pathologies due to Covid-19. This can be done by analysing images of the same patient acquired at different dates. Since no analytical model is available, and also no accurate quantification tools can be used due to many unknowns about the pathology, feature-free methods are good candidates to analyse such temporal images.
Objective:
This contribution helps improving performances of medical structures facing the Covid-19 pandemic. The first impact is medical and social since more lives could be saved with a 92% rate of good prognosis. In addition to that, patients in intensive care units (up to 15%) could a posteriori suffer from less sequels due to an early and accurate prognosis of their PP. Moreover, accurate prognosis can lead to a better planning of patient’s transfer between units and hospitals, which is linked to the second claimed economical impact. Indeed, prognosis is linked to lower treatment costs due to an optimized predictive protocol using ragiological prognosis.
Methods:
Using Convolutional Neural Networks (CNN) in combination with Recurrent Neural Networks (RNN). Spatial and temporal features are combines to analyse image time series. A prognosis score is delivered indicating the severity of the pathology. Learning is made on a publicly available database.
Results:
When applied to radiological time-series, promising results are obtained with an accuracy rates higher than 92%. Sensitivity and specificity rates are also very interesting.
Conclusion:
Our method is segmentation-free, which makes it competitive with respect to other assessment methods relying on time-consuming lung segmentation algorithms. When applied on radiographic data, the proposed ProgNet architecture showed promising results with good classification performances, especially for ambiguous cases. Specifically, the reported low false positive rates are interesting for an accurate and personalised care workflow.
1. IMPACT STATEMENT
This paper presents a technical solution to prognoses the evolution of Covid-19 pulmonary pathology based on a time-series of X-ray images and helps improve the performances of medical structures facing the Covid-19 pandemic. The first impact is medical and social since more lives could be saved with a 92% rate of good prognosis. In addition to that, patients in intensive care units (up to 15%) could a posteriori suffer from less sequels due to an early and accurate prognosis of their pulmonary pathology. Moreover, an accurate prognosis can lead to better planning of patient’s transfer between units and hospitals, which is linked to the second claimed economic impact. Indeed, the prognosis is linked to lower treatment costs due to an optimized predictive protocol using radiological prognosis.
2. INTRODUCTION
Coronaviruses are a large family of viruses that can cause a variety of diseases in humans, ranging from colds to Severe Acute Respiratory Syndrome (SARS) in 2003 and Middle East Respiratory Syndrome (MERS) in 2012. In recent months, the World Health Organization (WHO) has declared that a new coronavirus called COVID-19 has spread aggressively to several countries around the world [1]. The specificity of COVID-19 is that it can cause respiratory tract disease, fever and cough, and severe pneumonia in some extreme cases [2, 3]. Pneumonia is an infection that causes inflammation mainly in the air sacs of the lungs responsible for oxygen exchanges [4, 5].
The COVID-19 pandemic can be considered serious due to its high contagion and severity, especially the lack of treatment so far [6]. The impact on healthcare systems is also high and crucial due to the number of people requiring intensive care units (ICU) admission and mechanical ventilators for long periods [7]. Making evidence of COVID-19 infection is generally associated with specific lung pathologies. The most reliable way is to perform PCR (Polymerase Chain Reaction) [8] tests to assess the presence of Covid-19 RNA (Ribonucleic Acid) in the hosting individual. PCR tests enjoy high precision rates. However, the main weakness of such a molecular method lies in its high specificity. Real-time PCR techniques have now replaced conventional PCRs because they are more sensitive, more precise, more reproducible, and suitable for large series. Moreover, results can be obtained in less than three hours [9].
Due to low testing capacity, especially at the very beginning of the pandemic spread, most countries performed tests generally on persons suffering from unclear and advanced symptoms, or individuals who evidently have been in contact with infected ones.
In this sense, chest X-ray imaging is a technique that plays an important role in the diagnosis of COVID-19 disease. Radiological tests may be performed by analyzing chest X-ray images and identifying lung tissues potentially hosting infections [10]. However, X-ray data analysis requires an expert in radiology and may be time-consuming. Therefore, developing an automated analysis system may solve this problem and help save precious time for radiologists. In this context, solutions based on artificial intelligence (AI) can provide an accurate and inexpensive diagnosis for COVID-19 and other types of pneumonia [11, 12]. Furthermore, it is important to assess the pathology evolution for infected people, especially those suffering from severe PP who may need intensive care. This is mainly essential since no specific treatment is known up to date, which means that a treatment line adaptation may be recommended if no improvement is observed. Pathology prognosis is also useful for prioritization of patients to take charge in case of limited numbers of ICUs [13, 14].
In this paper, we propose a method for pathology prognosis based on analysing the time series of chest X-ray images. The proposed method is based on both recurrent and convolutional neural networks, and allows to classify patients into two severity classes: positive or negative evolution. The main originality lies in the use of such a combination for COVID- 19 prognosis.
The rest of this paper is organized as follows. After an introduction covering the context of this research and the problem to be handled, Section III is devoted to a state of the art linked to our research. In Section IV, an overview of the proposed approach is presented, and all the steps are detailed for the multi-temporal classification of X-ray images. Experimental validation is illustrated in Section V. Therefore, discussion and limitation are presented in Section VI. Finally, conclusions and future work are drawn in Section VII.
3. RELATED WORK
Time series data refer to a consistent flow of data sets over a period spaced in time. The analysis of these series has become a recent area of interest in artificial intelligence. Accurate forecasting is becoming more and more vital in all areas in order to make more informed and precise decisions. Time series analysis is mainly used for: i) descriptive analysis, i.e, identifying trends in the correlated data, ii) forecasting, to predict short-term events and iii) intervention analysis to see how the event can be evaluated during the time series.
On the other hand, analysing time series generally presents the drawback related to the lack of annotated data sets. Annotations for time Tn generally have to account for times Ti with i < n. Having comparable data (same quality, size,...) is, therefore, an additional problem that leads to difficulty in designing specific algorithms. In this sense, several applications in the literature have addressed this problem, especially in clustering [15], change classification [16], change detection [17, 18], and forecasting [19].
In medical imaging, time series are often used for functional [20-22] and spectroscopic [22] imaging, as well as motion analysis [23]. In this context, X-ray images, and specifically CT (Computerized Tomography) are widely used due to its high spatial and temporal resolutions. As regards lung diagnosis, X-ray images are usually used to track pneumonia or other specific diseases. To analyse 3D + t (3D+time) data, one usually needs to design sophisticated algorithms that are automatic, user-friendly, fast and accurate [24].
Today, Deep Learning (DL) has demonstrated its efficiency as stated hereabove in many fields of image analysis. Specifically, convolutional neural networks (CNN) [25] are among the most used networks to analyze visual imagery. The specificity of CNN lies in its ability to learn features automatically and without human intervention from given images, in contrast to classical machine learning methods where the designer has an obligation to specify the features to be extracted, which always depends on the application context. Since 2012, several models of deep convolutional neural networks (DCNN) [26] have been proposed such as AlexNet [27], VGG [28], GoogleNet [29], Residual Net [30], Dense Net [31] and Capsule Net [32].
As regards to data related to Covid-19, very recent works have already started to design diagnosis aid tools based on DL in order to detect Covid-19 specificities in chest X-ray images. All the approaches used deep learning for image classification as Covid or non-Covid. In the study [33], a modified neural network ”ResNet-50” has been proposed, on which a Feature Pyramid Network (FPN) is used to identify and extract lesions automatically from CT images. Using this approach, the model can detect and classify CT images into three possible classes: healthy, COVID-19, and bacterial pneumonia. Likewise, chest radiographic images (CXR) has been used in the study [34]. The authors use CNN based on various ImageNet1 pre-trained models to extract high-level features (deep features). Those different features were fed into a Support Vector Machine (SVM) as a machine learning classifier that constitutes the major improvement of this approach. Using the SVM classifier, is to classify the radiographic images affected by the corona effect coming. In the study [35], a novel approach proposed by the authors uses a COVID-Net architecture with transfer learning to classify CXR images into four classes: normal, bacterial infection, infection non-COVID, and COVID-19 virus. Another study [36] adopts a DeTraC deep CNN architecture [37] where the general idea is to add a class decomposition layer to the preformed models. In the proposed module, the class decomposition layer, aims to partition each class of the image dataset into several sub-classes. New labels are then assigned to the new set, where each subset is considered an independent class. After that, these subsets are assembled to produce the final predictions.
The performance described in the previous paragraph of COVID-19 classification can be resumed by using the transfer learning that provides an effective solution with the limited availability of annotated images by transferring knowledge from pre-trained CNN to the specific medical imaging task. State of the art described approaches had shown very high efficiency for the classification of COVID-19 infected patients by comparing the performance measures presented in all the models. The model gets accuracy and sensitivity values of around 98%, while it is between 91% and 95% for the other presented models [37]. For precision criteria, the values are quite similar and are approximately 94%. On the other hand, the authors in the study [35] showed a positive predictive value between 91% and 93% for the non-covid and normal class while around 88% for the covid class.
Despite the efficiency and the performances obtained by the various techniques described above for the detection of COVID-19, these approaches do not account for temporal correlations and only provide a decision about a single image. Prognosis remains, therefore, an open issue. Indeed, once a patient is declared infected, especially for those taken in charge in hospitals, it is important to monitor the evolution of the PP.
This monitoring can allow doctors to analyze survival probability for severe cases, and hence classify them into at least two classes: i) potential positive response to treatment and ii) no expected positive evolution. For hospitals with low capacity or suffering from a lack of specific equipment, giving priority to the first class based on prognosis tools is definitely better than doing it randomly. In this paper, we propose a method to analyse time series of lung images related to infected patients in order to derive a prognosis whether the pathological state is getting better or not.
Recurrent neural networks (RNN) are a family of deep learning methods designed to manage temporal correlations between images in time series. These networks have recurrent connections, i.e., the output from the previous steps are fed as input to the current step, in the sense that they keep information in memory: they can take into account at time Tn a number of past states Ti where i < n. These networks have been used in remote sensing to assess change detection in multi-spectral and hyper-spectral images [38]. RNNs are able to memorize information for a limited time. The major problem is that they start to “forget” after a certain number of iterations, which complicates the training for many applications. The algorithms used for updating the weight in RNNs are mainly based on the gradient with some well known practical problems such as gradient explosion. To overcome this limitation, Long-Term Short-Term Memory (LSTM) has been proposed as a particular type of RNN [39-41]. These models explicitly capture recursive temporal correlations, and they have already proven their effectiveness in various fields, such as speech recognition [42], natural language processing [43] and image completion [44]. LSTMs have recently been used in medical imaging, where the authors propose a method with multi-modality and adjacency constraints for the segmentation of the cerebral image [45].
Finally, it is worth noting that LSTMs and CNNs have been combined in a number of works like [46-48].
4. METHODOLOGY
4.1. General Overview
The proposed methodology consists of applying a deep learning architecture for the multi-temporal classification of X-ray images in order to evaluate the COVID-19 evolution, and hence draw a vital prognosis for infected patients. The proposed methodology is based on the combination of CNN and RNN architectures. The CNN acts like a trainable feature detector for the spatial signal. It learns powerful convolutional features, which operate on the spatial input image while the RNN receives a sequence of such high-level representations in order to assess the temporal evolution of images. The proposed architecture hence classifies the time series into two main classes: positive and negative evolution. Such a classification can help doctors guess a vital prognosis for patients in critical situations.
Our architecture is capable of automatically learn temporal correlations of images provided as input. Fig. (1) gives a general overview of the proposed ProgNet architecture.
For an X-ray sequence T = (T1, T2, . . ., Tn), each image Ti goes through a CNN in order to extract a characteristic vector. The obtained vector involves a set of information subsequently generated by applying several convolutions followed by pooling layers. As a specific configuration, ResNet50 is one of the potential candidates to be used as a CNN, which has shown its efficiency in different image classification applications.
An RNN is then applied to learn temporal correlations between the different characteristic vectors related to each image of a sequence T. LSTM is used due to its good performance demonstrated in the literature [38-40]. Four fully connected layers with a sigmoid decision function are then applied to perform binary classification. A detailed description of the adopted networks is provided in Section IV-B.
4.2. Used Networks
1) ResNet: Residual networks (ResNet) is a classic CNN used as a backbone for many computer vision tasks. This model won the ImageNet challenge in 2015. In deep networks, low, medium, and high functionality and classifiers are extracted into a set of layers. ResNet mainly solves two key problems generally faced in the training deep neural networks: vanishing and exploding gradients. The core idea of ResNet is to introduce the “identity shortcut connection” which skips one or more layers. Fig. (2) [left] illustrates plain layers where each convolution is connected to each other, which is the idea of all architectures before the appearance of ResNet, while Fig. (2)[right] shows the residual network (Skip connection). Skipping layers allows avoiding gradient to vanish during back-propagation. Using such connections, one can train extremely deep networks that can take advantage of the power of depth, and hence allow capturing complex patterns in data.
As illustrated in Fig. (3), the ResNet50 [30] architecture used in this study is made up of 5 blocks, where each of them contains a set of convolution and max-pooling layers, followed by a skip connection.
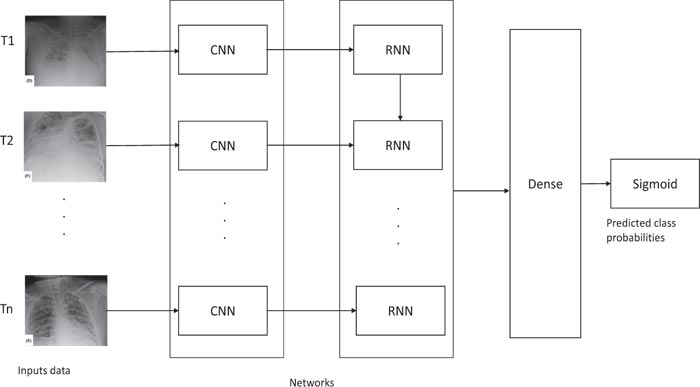 |
Fig. (1). Overview of the proposed ProgNet architecture. |
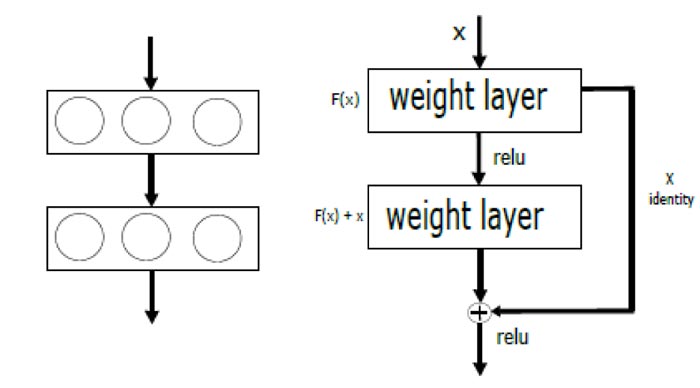 |
Fig. (2). Plain layers (left) and Residual blocks with skip connection (right). |
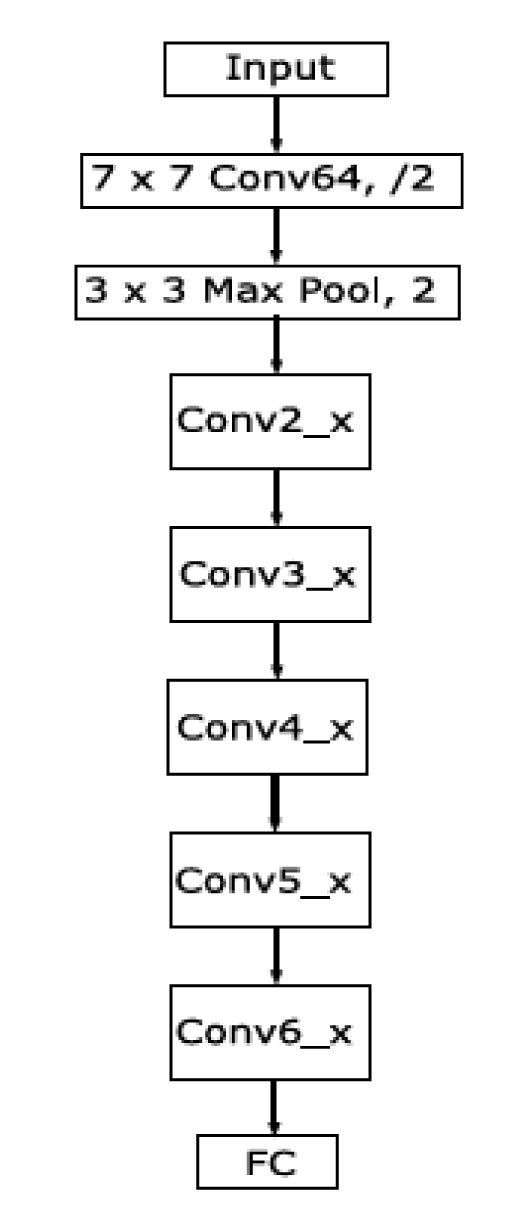 |
Fig. (3). Summarized overview of the ResNet50 architecture. |
(1) LSTM: In some cases, it is important to know what decisions have been made in the past in order to make an optimal and precise decision at time t. LSTMs are adopted here given his capability to learn the long-term dependence of time series data and to solve the problem of gradient vanish on the time axis. Mixing long and short-term dependencies in chest X-ray images is important and complementary with spatial dependencies analyzed by our CNN. LSTMs have sophisticated dynamics that allow them to easily “memorize” information for an extended number of time-steps. The “long term” memory is stored in a vector of memory cells {C1, C2,...Cn }. Although some differences exist in LSTM architectures, all of them have explicit memory cells for storing information for long periods of time. The basic functionalities of LSTM are: decide to overwrite the memory cell, retrieve it, or keep it for the next time step. A typical LSTM cell is illustrated in Fig. (4).
 |
Fig. (4). Detailed LSTM cell architecture. |
In Fig. (4), the cell input is denoted by Xt (input data), while ht−1 stands for the state hidden at the previous step, and Ct−1 corresponds to the previous memory cell. The cell outputs are the next hidden state ht and memory cell Ct.
LSTM architecture differs from the standard recurrent neural networks by two major points at the level of the blocks that constitute. First, the most crucial element is the state of the cell, which contains the information to be memorized and transmitted to the next cells. It is divided into two parts, the long-term states Ct and short-term ht. Second, three control gates along the state path (forget, input, and output gates) are added to regulate and process the cell states.
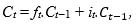
The first step of an LSTM cell is to determine the amount of information to be rejected from the input data Xt and the previous output ht−1. This decision is always made by a sigmoid layer 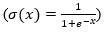 called “forget gate layer (ft)”. It evaluates the quantities ht−1 and Xt in order to produce for each cell state Ct−1 values between 0, i.e., ignore the value, and 1 to keep it. Eq.(1) shows how to control the information removal from the previous long-term state Ct−1:
 |
(1) |
where σ is the sigmoid function, Wf and bf corresponds to the weight matrix and bias.
The next step, input gate, is to generate the new information, which must be memorized in the cell state and forward to the next state. To do this, we must proceed by two steps: first, a layer sigmoid called ”input gate layer it” (Eq.(2)) decides the values that we need to update. Then, a tangent hyperbolic layer  aims to create a vector of new candidate values Ct (Eq.(3)), which will be added to the state. These elements are then combined to create a state update:
 |
(2) |
 |
(3) |
As in Eq. (1), Wi and Wc stand for weight matrices, while bi and bc are the bias terms.
In an LSTM cell, the old cell state Ct−1 has then to be updated into the new cell state Ct following Eq.(4):
 |
(4) |
where “.” is the point-wise matrix multiplication.
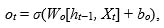
The last step, output gate, to decide the final information produced at the end of the cell. The output gate ot calculation is based on the cell state following Eq. (5), while the hidden state is updated according to Eq. (6):
 |
(5) |
 |
(6) |
In Equation (5), Wo and bo correspond to the weight matrix and bias. The output of the block is recurrently connected back to the block input and all of the gates.
5. EXPERIMENTAL VALIDATION
In this section, we illustrate the performance of the proposed architecture for COVID-19 prognosis.
Experiments are conducted on an open database of COVID-19 cases with chest radiographs2. To the best of our knowledge, this is the only available dataset containing temporal acquisitions for a number of patients, with ground truth annotation as a therapeutic issue for each patient: death or survival. The limited number of available data, as well as considering a single database, could introduce some bias that we are not able to evaluate in this paper. This issue has already been outlined in a number of recent studies [49]; some of them are even linked to Covid-19 X-ray diagnosis [50].
The used database contains data for 42 patients, with up to 5 images for the same subject. For the validation of the proposed architecture, we used 34 sequences for training; each includes 3 X-ray images of the same patient, and 8 sequences for the test.
To implement our ProgNet architecture, we put four dense layers, respectively, FC-1024, FC-500, FC-128, and FC-64. As regards coding, we used python programming language with Keras and Tensorflow libraries on an Intel(R) Core(TM) i7- 3630QM CPU 2.40GHZ architecture with 8 Go memory.
In order to assess the performance of the proposed ProgNet architecture on the available data, we performed comparisons with three other possible configurations. Each configuration relies on a different CNN (see Fig. 1): AlexNnet, VGG16, VG19. These networks have already demonstrated outstanding performance in the literature.
5.1. Loss and Accuracy Behavior
We first assess and compare the training and validation errors during the training procedure.
We used an ADAM optimization technique with a learning rate of 10−4 and binary cross-entropy loss. The minimum batch size was 32 and 60 epochs were considered. The weight decay was set to 10−4 to prevent over-fitting while training the model. The momentum value was set to 0.9. As regards the depth of the used LSTM, we defined 150 hidden units and added a dropout layer of 0.5.
Fig. (5) displays the obtained train accuracy and loss curves for the proposed ProgNet (Fig. 5d) as well as the other used configurations: AlexNnet (Fig. 5d), VGG16 (Fig. 5b), VG19 (Fig. 5c). The displayed curves indicate similar convergence performance with the superiority of our approach.
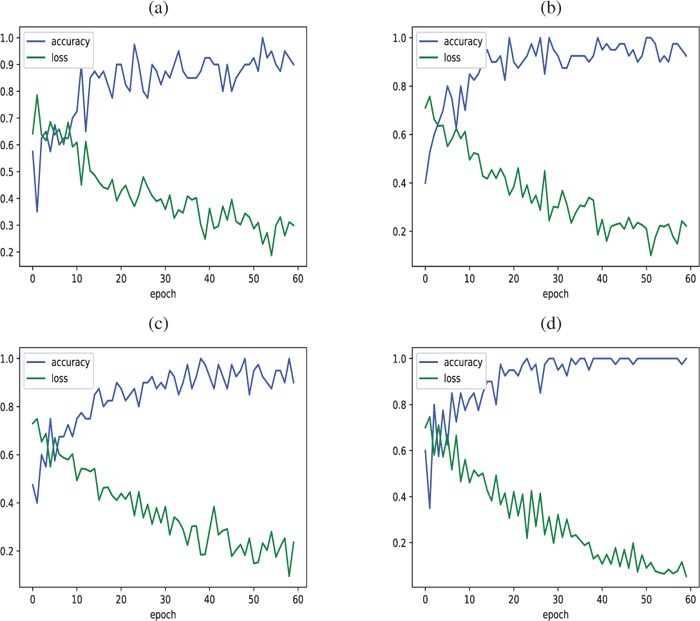 |
Fig. (5). Accuracy/Loss of the learning train obtained with (a) AlexNet, (b) VGG16, (c) VGG19 and (d) ProgNet. |
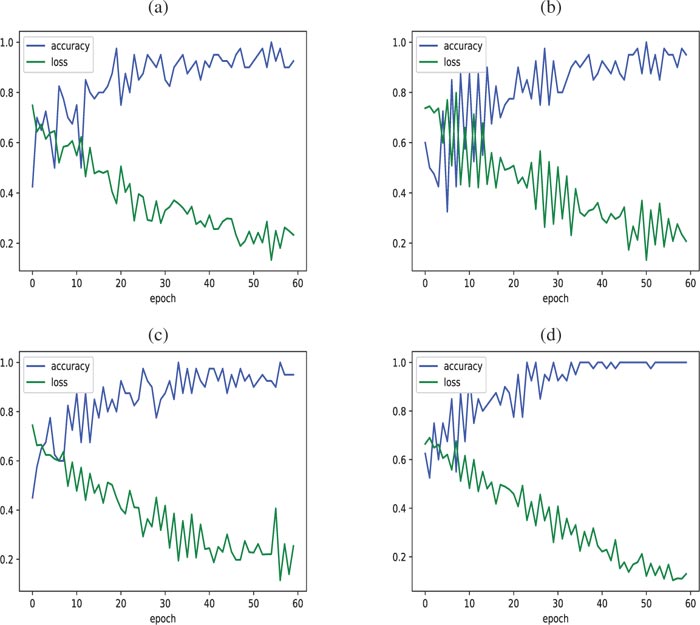 |
Fig. (6). Accuracy/Loss of the learning test curves obtained with (a) AlexNet, (b) VGG16, (c) VGG19 and (d) ProgNet. |
As regards the test set, Fig. (6) displays accuracy and loss curves for all architectures. When visually inspecting (Fig. 6d), we see that the loss and accuracy curves get better faster for the ProgNet architecture with a more stable behavior. Training with the ProgNet architecture is, therefore, faster and more efficient than the other configurations, partly due to the CNN depth.
It is worth noting that the observed peaks in the accuracy and loss curves may be caused by a lack of representatives of the training and test data, and hence difficulty in learning some fine features. This deserves more investigation to assess the ability of the model to generalize [51, 52]. This is mainly due to the limited number of available time-series of X-ray chest images related to Covid-19.
5.2. Quantitative Evaluation
To further assess the performance of the proposed method, Table 1 reports obtained values for the rates of True Positives (TP), True Negatives (TN), False Positives (FP) and False Negatives (FN). As reported in Table 1, all the networks perform well with TP rates over 87%. However, the proposed ProgNet architecture slightly outperforms the others with the highest TP and TN rates, while the FN and FP rates are also the lowest. By enjoying the lowest FN, the proposed architecture appears very interesting since, for such a prognosis, it is crucial to not miss negative evolution cases.
To further assess the quantitative performance, accuracy, precision and recall are also provided in Table 2, in addition to the F1 score [53]. The F1 score takes into consideration both precision and recall in order to validate the accuracy. It is the harmonic mean of both measures and can be calculated as
 |
(7) |
In Table 2, the mean values over 10 runs are provided. For each run, a subset of training data is randomly chosen. Standard deviations over the 10 runs are also provided in the table.
Through the reported values, one can easily notice that the proposed ProgNet method outperforms the other competing architectures. Specifically, higher precision and recall values indicate that ProgNet is more efficient in retrieving ambiguous infection cases. Moreover, the reported low standard variation values show better stability for the proposed model, indicating better generalization properties. A visual inspection of ambiguous time-series is provided in Section V-C.
5.3. Qualitative Analysis
In this section, we illustrate some representative results obtained on a group of patients. These time series are made up of 3 images acquired at times T1, T2 and T3. Fig. (7) displays four-time series of Covid-19 patients, two of them (top) have survived, while the two others (bottom) are dead. For each patient, the obtained “survival score” (SS) is provided in the first column. This score is nothing but the probability predicted by the sigmoid function.
| TP | FN | FP | TN | |
|---|---|---|---|---|
| AlexNet | 89.54% | 10.83% | 10.46% | 89.17% |
| VGG16 | 91.20% | 8.15% | 8.8% | 91.85% |
| VGG19 | 92.01% | 7.09% | 7.99% | 92.91% |
| ProNet | 95.41% | 5.23% | 4.59% | 94.77% |
 |
Fig. (7). Visualization of the COVID-19 classification using the propose ProgNet architecture. |
| AlexNet | VGG16 | VGG19 | ProgNet | |
|---|---|---|---|---|
| Accuracy | 0.893 ±0.07 |
0.915 ±0.03 |
0.924 ±0.04 |
0.950 ±0.03 |
| Precision | 0.820 ±0.08 |
0.912 ±0.02 |
0.920 ±0.03 |
0.954 ±0.02 |
| Recall | 0.818 ±0.09 |
0.917 ±0.05 |
0.928 ±0.06 |
0.948 ±0.04 |
|
F1 score |
0.818 ±0.06 |
0.914 ±0.03 |
0.923 ±0.04 |
0.950 ±0.02 |
 |
Fig. (8). Examples of time-series well classified by ProgNet for which the competing methods fail. |
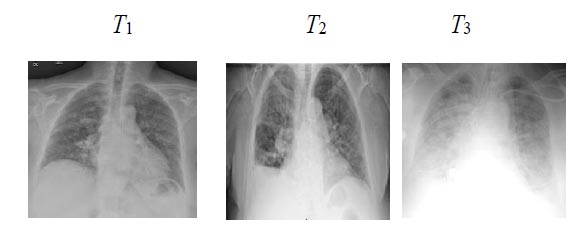 |
Fig. (9). Images of an ambiguous time-series mis-classified by ProgNet. |
From a visual point of view, it is clear that time-series with death issues show more white areas over all images. Generally speaking, the spread of these areas increases over time. Reported SC values indicate how sure the ProgNet model is about the classification results for these time-series.
As reported in the previous section, good precision and recall values indicate the ability of our ProgNet architecture to properly classify ambiguous cases. In this sense, Fig. (8) shows two examples of time-series corresponding to two patients with survival and death issues. These patients are well classified by the proposed ProgNet architecture, while the competing methods misclassify them. When visually inspecting the images for the death issue, ambiguity comes from extended white areas in all the images with no visible improvement over time. The same remark holds for the survival case where white areas persist over time.
To investigate why the proposed ProgNet architecture fails to classify some cases, Fig. (9) shows images of a time-series linked to a patient mis-classified by ProgNet. Indeed, we notice, in some cases, an unexpected change in the situation of a patient during the last image of the sequence. This can lead to some problems in learning all features and managing the time correlation between them. Analysing longer sequences can certainly improve model performance.
6. RESULTS AND DISCUSSION
Using deep learning to analyse temporal series is today an open research field in many applications such as medical imaging [54]. Specifically, LSTMs are efficient and scalable models for several learning problems related to sequential data. It has been used for a long time in many fields [55]. In this paper, we have shown how to combine CNN and LSTM framework for temporal classification of COVID-19 evolution. Behind this technical combination, the application to prognosis in Covid-19 evolution has a great potential for any healthcare system. The proposed solution has been validated using chest radiography data. The main goal is to assist doctors to save a maximum number of COVID-19 infected patients. Indeed, since many healthcare systems are being saturated because of the exponential growth of Covid-19 infections, using AI to help deciding which patients have more chance to recover, is of great interest in the unfortunate case where no enough equipments are available to offer intensive cares to all patients [56].
We designed a model that is able to handle temporal series while involving different CNN and RNN architectures. The retained architecture, called ProgNet, is the one that outperforms all the other combinations using the most efficient CNNs of the literature, such as AlexNet, VGG16, and VG19. A CNN architecture using Resnet with 50 convolutional layers has been retained. Fig. (5) and Fig. (6) show that our model achieved good temporal classification accuracies. This may be explained by the fact that using deeper layers helps extracting more implicit features and avoids the overfitting problem [57]. As shown in the results section, quantitative and qualitative results of the proposed ProgNet architecture are promising. Specifically, the good convergence, precision and stability properties have to be confirmed on larger datasets. This may help assessing how robust the proposed method is with respect to constructor and acquisition conditions variabilities [58].
As with most Deep Learning-based approaches, large training datasets are essential [59]. This is the main limitation of the proposed method. As regards performances, some miss-classifications may be avoided by revising the LSTM architecture, especially the feature selection procedure using the forget gate. We expect a higher impact of improving the LSTM architecture for long time series. Indeed, since our approach performs both spatial and temporal analysis of images, experiments and processed data (Figs. 7, 8 and 9) show that the temporal analysis plays a more important role due to high similarity levels between spatial images.
CONCLUSION
In this paper, we proposed an architecture for Covid-19 prognosis, based on a combination of CNN and RNN networks. The proposed architecture analyses both spatial and temporal dependencies in the input time-series of chest X-ray images. Our method is segmentation-free, making it competitive with respect to other assessment methods relying on time-consuming lung segmentation algorithms. When applied to radiographic data, the proposed ProgNet architecture showed promising results with good classification performances, especially for ambiguous cases. Specifically, the reported low false-positive rates of 4.59% (50% lower than the other approaches) are promising for an accurate and personalized care workflow.
Future work will focus on applying the proposed architecture to CT data with longer time-series. However, data availability and homogeneity is a key issue. In this sense, the proposed architecture has to be adapted in order to handle data heterogeneity in time (time-series with different sizes). Future work will also consider validating the proposed method on other types of pneumonia to investigate its efficiency in the prognosis of the pathology evolution.
ETHICS APPROVAL AND CONSENT TO PARTI-CIPATE
Not applicable.
HUMAN AND ANIMAL RIGHTS
Not applicable.
CONSENT FOR PUBLICATION
Not applicable.
AVAILABILITY OF DATA AND MATERIALS
Not applicable.
FUNDING
The authors are grateful for the Graduate Student Research Grant provided by Naresuan University Graduate School and acknowledge 3M/ESPE, ACCORD Corporation Limited, and Dentsply (Thailand).
CONFLICT OF INTEREST
The authors declare no conflict of interest, financial or otherwise.
ACKNOWLEDGEMENTS
The authors are grateful for the Graduate Student Research Grant provided by Naresuan University Graduate School and acknowledge 3M/ESPE, ACCORD Corporation Limited, and Dentsply (Thailand) for their kind support in providing the restorative materials used in this study. The authors also thank Mr. Paul Freund of Naresuan University Writing Clinic (DIALD) for editing assistance and advice on English expression.
REFERENCES
| [1] | Chaari L, Golubnitschaja O. Covid-19 pandemic by the “real-time” monitoring: the Tunisian case and lessons for global epidemics in the context of 3PM strategies. EPMA J 2020; (10223): 1-6. |
| [2] | Huang C, Wang Y, Li X, et al. Clinical features of patients infected with 2019 novel coronavirus in Wuhan, China. Lancet 2020; 395(10223): 497-506. |
| [3] | Gautret P, Lagier J-C, Parola P, et al. https://www.mediterranee- infection.com/wp-content/uploads/2020/03/COVID-IHU-2-1.pdf2020. |
| [4] | Sohrabi C, Alsafi Z, O’Neill N, et al. World health organization declares global emergency: A review of the 2019 novel coronavirus (covid-19). Int J Surg 2020. |
| [5] | Li Heng, Liu Shang-Ming, Yu Xiao-Hua, Tang Shi-Lin. Coronavirus disease 2019 (covid-19): current status and futureperspective International journal of antimicrobial agents 2020; 105951. |
| [6] | Chih-Cheng L, Tzu-Ping S, Wen-Chien K, Hung-Jen T. Int J Antimicrob Agents 2020; 55(3)105924 |
| [7] | Jo S, Kim S, Shin DH, Kim MS. Inhibition of SARS-CoV 3CL protease by flavonoids. J Enzyme Inhib Med Chem 2020; 35(1): 145-51. |
| [8] | Corman VM, Landt O, Kaiser M, et al. Detection of 2019 novel coronavirus (2019-nCoV) by real-time RT-PCR. Euro Surveill 2020; 25(3): 1-8. |
| [9] | Deepak S, Kottapalli K, Rakwal R, et al. Real-Time PCR: Revolutionizing Detection and Expression Analysis of Genes. Curr Genomics 2007; 8(4): 234-51. |
| [10] | Zhou SA, Brahme A. Development of phase-contrast X-ray imaging techniques and potential medical applications. Phys Med 2008; 24(3): 129-48. |
| [11] | Xiaowei X, Xiangao J, Chunlian M, et al. https://arxiv.org/ftp/ arxiv/papers/2002/2002.09334.pdf2020. |
| [12] | Shi F, Wang J, Shi J, et al. Review of artificial intelligence techniques in imaging data acquisition, segmentation and diagnosis for covid-19. IEEE Rev Biomed Eng 2020; PP: 1-1. |
| [13] | Leslie Kevin O. Pulmonary pathology of the rheumatic diseases Seminars in respiratory and critical care medicine 2007; 28: 369-78. |
| [14] | Rothan HA, Byrareddy SN. The epidemiology and pathogenesis of coronavirus disease (COVID-19) outbreak. J Autoimmun 2020; 109102433 |
| [15] | Chandra B, Gupta M, Gupta MP. A multivariate time series clustering approach for crime trends prediction 2008 IEEE International Conference on Systems, Man and Cybernetics 2008; 892-6. |
| [16] | Woz ́niak, E, Kofman W, Aleksandrowicz S. Multi-temporal indices derived from time series of sentinel-1 images as a phenological description of plants growing for crop classification 10th International Workshop on the Analysis of Multitemporal Remote Sensing Images (MultiTemp) 2019; 1-4. |
| [17] | Lin Y, Zhang L, Wang N. A new time series change detection method for landsat land use and land cover change 2019. |
| [18] | Gharbi W, Chaari L, Benazza-Benyahia A. Unsupervised bayesian change detection for remotely sensed images. Signal Image Video Process 2020. |
| [19] | Chuentawat R, Kan-ngan Y. The comparison of PM2.5 forecasting methods in the form of multivariate and univariate time series based on support vector machine and genetic algorithm 2018. |
| [20] | Chaari L, Vincent T, Forbes F, Dojat M, Ciuciu P. Fast joint detection-estimation of evoked brain activity in event-related FMRI using a variational approach. IEEE Trans Med Imaging 2013; 32(5): 821-37. |
| [21] | Albughdadi M, Chaari L, Tourneret JY, Forbes F, Ciuciu P. A bayesian non-parametric hidden markov random model for hemody- namic brain parcellation. Signal Processing 2017; 135(10223): 132-46. |
| [22] | Bouaziz B, Chaari L, Batatia H, Quintero-Rincon A. Epileptic seizure detection using a convolutional neural network 2018. |
| [23] | Laruelo A, Chaari L, Batatia H, et al. Hybrid sparse regularization for magnetic resonance spectroscopy IEEE International Conference of Engineering in Medicine and Biology Society (EMBC) Osaka, Japan. 2013; pp. 2013; 6768-71. |
| [24] | Prümmer M, Hornegger J, Lauritsch G, Wigström L, Girard-Hughes E, Fahrig R. Cardiac C-arm CT: a unified framework for motion estimation and dynamic CT. IEEE Trans Med Imaging 2009; 28(11): 1836-49. |
| [25] | Zewen L, Wenjie Y, Shouheng P, Fan L. A survey of convo- lutional neural networks: Analysis, applications, and prospects 2020. |
| [26] | Sainath TN, Abdel-rahman M, Kingsbury B, Ramabhadran B. “Deep convolutional neural networks for LVCSR,” in 2013 IEEE international conference on acoustics, speech and signal processing 2013; 8614-8. |
| [27] | Alex K, Ilya S. Imagenet classification with deep convolutional neural networks Advances in neural information processing systems 2012; 1097-105. |
| [28] | Karen S, Andrew Z. Very deep convolutional networks for large- scale image recognition 1409.15562014. |
| [29] | Fang T. A novel computer-aided lung cancer detection method based on transfer learning from googlenet and median intensity projections IEEE International Conference on Computer and Communication Engineering Technology (CCET) 2018; 286-90. |
| [30] | Kaiming H, Xiangyu Z, Shaoqing R, Jian S. Deep residual learning for image recognition Proceedings of the IEEE conference on computer vision and pattern recognition 2016; 770-8. |
| [31] | Wu Z, Hai J, Zhang L, Chen J, Cheng G, Yan B. Cascadedfully convolutional densenet for automatic kidney segmentation in ultrasound images 2nd International Conference on Artificial Intelligence and Big Data (ICAIBD) 2019; 384-8. |
| [32] | Arun PV, Buddhiraju KM, Porwal A. Analysis of capsulenets towards hyperspectral classification 9th Workshop on Hyperspectral Image and Signal Processing: Evolution in Remote Sensing (WHIS- PERS) 2018; 1-5. |
| [33] | Ying S, Shuangjia Z, Liang L, et al. Deep learning enables accurate diagnosis of novel coronavirus (covid-19) with ct images medRxiv 2020. |
| [34] | Prabira Kumar S, Santi Kumari B. Detection of coronavirus disease (covid-19) based on deep features. Preprints 2020; 2020030300: 2020. |
| [35] | Linda W, Alexander W. Covid-net: A tailored deep convolutional neural network design for detection of covid-19 cases from chest radiography images 2020. |
| [36] | Asmaa A. Classification of covid-19 in chest x-ray images using detrac deep convolutional neural network arXiv preprint arXiv:200313815 2020. |
| [37] | Abbas A, Abdelsamea MM, Gaber MM. Detrac: Transfer learning of class decomposed medical images in convolutional neural networks. IEEE Access 2020; 1-1. |
| [38] | Rußwurm M. ISPRS Int J Geoinf 2018; 7(4): 129. |
| [39] | Sepp H. Neural Comput 1997; 9(8): 1735-80. |
| [40] | Kamilya S, Alex Pappachen J. A survey on lstm memristive neural network architectures and applications. Eur Phys J Spec Top 2019; 228(10): 2313-24. |
| [41] | Greff K, Srivastava RK, Koutnik J, Steunebrink BR, Schmidhuber J. LSTM: A Search Space Odyssey. IEEE Trans Neural Netw Learn Syst 2017; 28(10): 2222-32. |
| [42] | Dutta K, Sarma KK. Multiple feature extraction for RNN-based assamese speech recognition for speech to text conversion application International Conference on Communications, Devices and Intelligent Systems (CODIS) 2012; 600-3. |
| [43] | Kahuttanaseth W, Dressler A, Netramai C. Commanding mobile robot movement based on natural language processing with RNN encoder decoder 5th International Conference on Business and Industrial Research (ICBIR) 2018; 161-6. |
| [44] | Wang Q, Fan H, Sun G, Ren W, Tang Y. Recurrent genera- tive adversarial network for face completion. IEEE Trans Multimed 2020; 1-1. |
| [45] | Kai X, Ying W. Lstm-ma: A lstm method with multi-modality and adjacency constraint for brain image segmentation IEEE International Conference on Image Processing (ICIP) 2019; 240-4. |
| [46] | Vittorio M, Aleem K, Marcello C. Improvement in land cover and crop classification based on temporal features learning from sentinel- 2 data using recurrent-convolutional neural network (r-cnn). Appl Sci (Basel) 2020; 10(1): 238. |
| [47] | Hu P, Tong J, Wang J, Yang Y, Oliveira Turci Ld. A hybrid model based on cnn and bi-lstm for urban water demand prediction IEEE Congress on Evolutionary Computation (CEC) 2019; 1088-94. |
| [48] | Heryadi Y, Warnars HLHS. Learning temporal representation of transaction amount for fraudulent transaction recognition using CNN, stacked LSTM, and CNN-LSTM IEEE International Conference on Cybernetics and Computational Intelligence (CyberneticsCom) 2017; 84-9. |
| [49] | Cohen Joseph Paul, Hashir Mohammad, Brooks Rupert, Bertrand Hadrien. On the limits of cross-domain generalization in automated x-ray prediction 2020. |
| [50] | Gianluca Maguolo and Loris Nanni. A critic evaluation of methods for covid-19 automatic detection from x-ray images 2020. |
| [51] | Gareth J, Daniela W, Trevor H, Robert T. An introduction to statistical learning 2013; Vol. 112 |
| [52] | Ian G, Yoshua B, Aaron C. Deep learning 2016. |
| [53] | Sasak Y. The truth of the F-measure 2007. |
| [54] | Nguyen VQ, Ma LV, Kim JY, Kim K, Kim J. Applications of anomaly detection using deep learning on time series data. 4th Intl Conf on Big Data Intelligence and Computing and Cyber Science and Technology Congress (DASC/PiCom/DataCom/CyberSciTech) 2018; 393-6. |
| [55] | Yang X, Ramesh P, Chitta R, Madhvanath S, Bernal EA, Luo J. Deep multimodal representation learning from temporal data. Proceedings of the IEEE Conference on Computer Vision and Pattern Recognition 2017; 5447-55. |
| [56] | Naudé W. Artificial Intelligence against COVID-19: An early review. IZA DP No 13110 2020. |
| [57] | Li H, Li J, Guan X, Liang B, Lai Y, Luo X. Research on overfitting of deep learning 2019. |
| [58] | Ivanikovas S, Dzemyda G, Medvedev V. Large datasets visualization with neural network using clustered training data. East European Conference on Advances in Databases and Information Systems 2008. |
| [59] | Vaya MI, Saborit JM, Montell JA, et al. BIMCV COVID-19+: a large annotated dataset of RX and CT images from COVID-19 patients. arXiv preprint arXiv: 200601174 2020. |